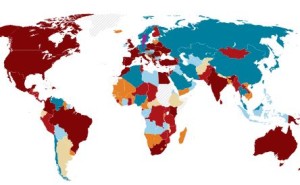
Passport is one of our most popular market research databases and although the content is great, visually, it has always looked a bit flat and uninspiring. However, this has now all changed thanks to the arrival of ‘Dashboards’ an add-on easily accessible from Passport’s menu bar which offers maps, charts and figures in an appealing graphically rich format, ideal for use in presentations and projects (properly attributed of course!)
With Dashboards you can now retrieve interactive images and charts on industries, consumer expenditure, economies, population, lifestyles, companies and brands, which is not only certain to bring the data alive, but also to make it easier to comprehend.


